
EZ Reports
ezReports is a reporting engine for ezPayPal.
Description
ezReports is an add-on module for ezPayPal, which provides a reporting and charting engine. It can be installed on the standalone version of ezPayPal Pro. Used it in conjunction with ezPayPal, this modules enables you to analyze your sales and revenue data with the help of charts so that you can pinpoint revenue-generation opportunities.
If you would like to start your e-commerce website, you can purchase the full package of ezReports ready-to-use online for only $12.95.
Features
- Seamless integration with ezPayPal.
- Multiple reports provided.
- Easy to add new reports with the help and sample report provided.
Credits
ezReports uses Open Flash Chart to render beautiful charts.
Installation
Note: ezReports is an add-on module for ezPayPal Pro. You can install and use it only if you have ezPayPal. Or you can purchase the bundled package of ezReports and ezPayPal ready-to-deploy for a discounted price of only $12.95.
- On ezPayPal screen, click on Pro Functions.
- Log in if prompted.
- Click on the Reporting Engine button against the Track your sales and revenue entry.
- Click on the Install Package and follow the friendly wizard.
Frequently Asked Questions
Can I use this package without *ezPayPal*?
Not in the current form. A future version that can work independently of ezPayPal will be released soon.
How do I create a new report?
The ezReports module is written with extensibility in mind. With a bit of PHP knowledge, it is child's play to add another report. Follow these steps to make your own report.
- Make a copy of a look at the sample report
chart-product.phpin the module folder (ezPayPal/pro/ezreports). - Rename it to
chart-<something>.php. Let's say you call itchart-myreport.php. - Edit
chart-myreport.phpand change the report name near the top of the file (line 9 in the current version.) - In the data section (after
if
  (isset($_GET['data']))
), define your own data. - Save and upload the modified
chart-myreport.phpto your server, to the same location aschart-product.php. - Your report is ready and deployed, and will appear in the drop down menu when you start the reporting engine.
Visit Open Flash Chart to see available chart formats and code samples.
Screenshots
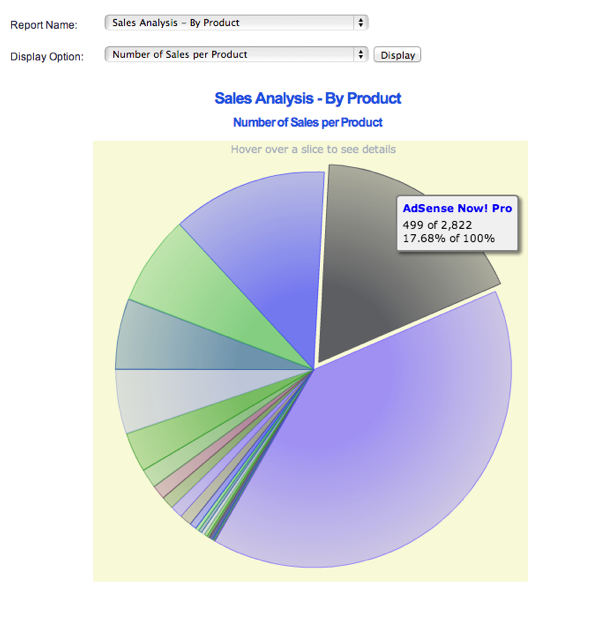
- Sample report - sales per product pie-chart.
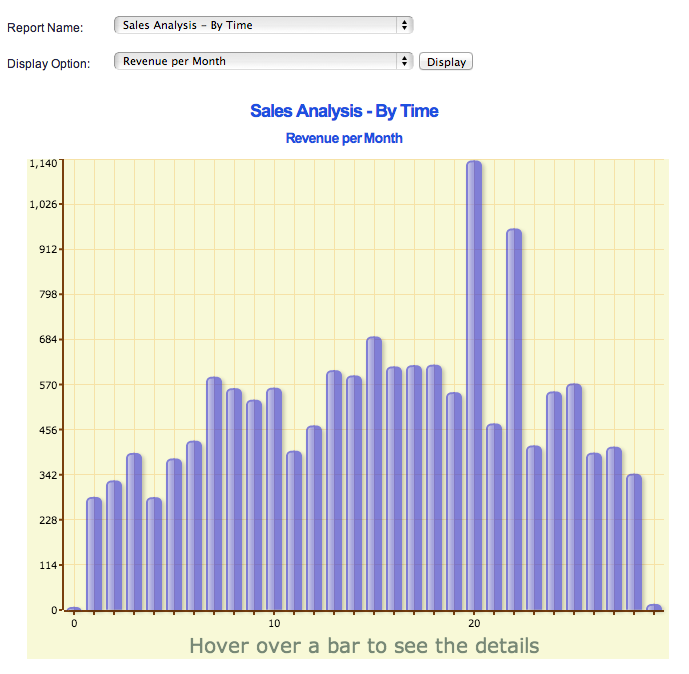
- Sample report - revenue per month.
Change Log
History
- V1.00: Initial release. [Nov 25, 2013]
Future Plans
- Provide more reports.
Changelog
History
- V1.00: Initial release. [Nov 25, 2013]
Future Plans
- Provide more reports.